What the heck are complex images?

Recently, I stumbled upon a post asking about how to create text alternatives for complex visuals like charts. I thought this was a great opportunity to explain how to provide a text alternative for complex images. Let’s dive in!
What are complex images?
A complex image is a great way to present your visual representation in an easy-to-understand, graphical way. For example:
- Infographics
- Charts and graphs
- Diagrams
- Maps
Have you noticed how many websites use visuals to explain complex information? It’s great, but sometimes these visuals are images, which can be difficult for everyone to access. Fortunately, we can create a text alternative for our customers so everyone can benefit. I’m going to show you how to do this with something we all love: dogs!
Alt text for complex images
It is important to ensure that all customers, including those with vision impairment, can quickly scan your page to decide what to focus on. We can make this process easier by providing an alt text summary of any complex images, followed by a text description. That way, they can quickly understand what the page is about, just like how we all scan headlines to decide if an article is worth reading.
If you’re not sure how to succinctly describe a complex image in your alt text, use this syntax:
<img alt="A(n) (type of complex image provide) of (data being provided) of (reason for providing the complex image)." />To learn more about the advantages of alt text, why not take a look at “How to get your image to do more”? It’s packed with helpful information that can make a real difference!
How to add the full description of your complex images
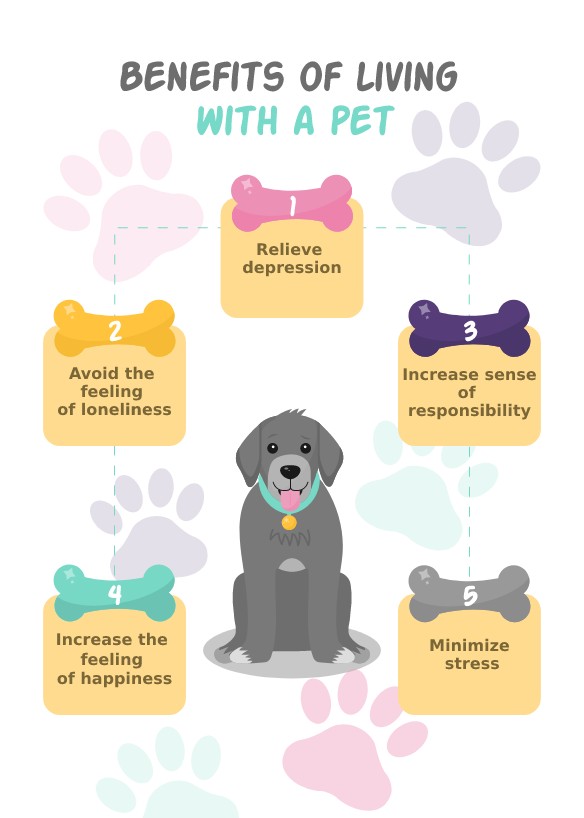
There are three common approaches to fully describe a complex image. Using the infographic “Benefits of Living with a Pet” as an example, I will demonstrate each approach.
Option 1
Provide a text alternative around your image (often placed under the image)
<img scr="pet-benefits.jpg" alt="An infographic with a gray dog in the center of the five benefits of owning a pet." />
<h2>Benefits of living with a pet</h2>
<ul>
    <li>Relieve stress</li>
    <li>Avoid the feeling of loneliness</li>
    <li>Increase sense of responsibility</li>
    <li>Increase the feeling of happiness</li>
    <li>Minimal stress</li>
</ul>
Option 2
Provide a link to the text version of your image. You can include it as an anchor on the same page or link to a different page.
<img scr="pet-benefits.jpg" alt="An infographic with a gray dog in the center of the five benefits of owning a pet." />
<a href="#petbenefits-textversion">Text version of infograph</a>

<h2 id="petbenefits-textversion">Benefits of living with a pet</h2>
<ul>
    <li>Relieve stress</li>
    <li>Avoid the feeling of loneliness</li>
    <li>Increase sense of responsibility</li>
    <li>Increase the feeling of happiness</li>
    <li>Minimal stress</li>
</ul>
Option 3
Use the aria-describedby attribute to connect your image to the id of its text alternative.
<img scr="pet-benefits.jpg" alt="An infographic with a gray dog in the center of the five benefits of owning a pet." aria-describedby="petbenefits-textversion" />

<h2 id="petbenefits-textversion">Benefits of living with a pet</h2>
<ul>
    <li>Relieve stress</li>
    <li>Avoid the feeling of loneliness</li>
    <li>Increase sense of responsibility</li>
    <li>Increase the feeling of happiness</li>
    <li>Minimal stress</li>
</ul>
Text alternatives for complex images
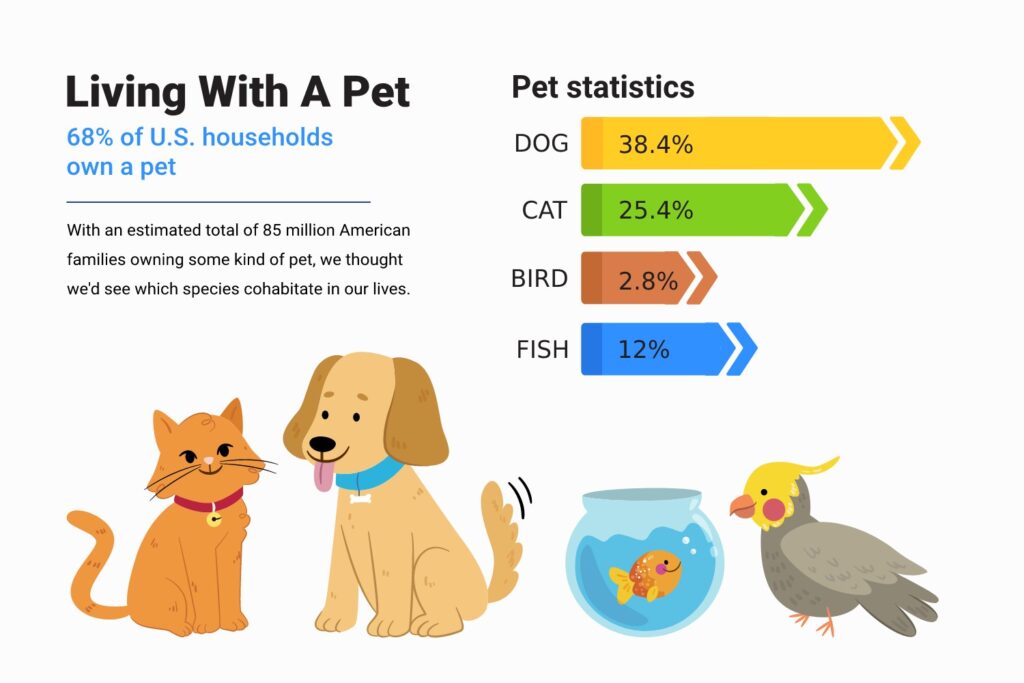
In the above image, “Benefits of Living with a Pet”, a list was used to quickly and simply provide the information. For more complex images, such as charts, graphs, or diagrams, a table is the most effective way to organize the text alternative.
Sample text alternative
<h2>Living With A Pet</h2>
<h3>68% of U.S. households own a pet</h3>
<p>With an estimated total of 85 million American families owning some kind of pet, we thought we'd see which species cohabitate our lives.</p>
<table>
	<caption>Pet statistics by species</caption>
  <tr>
    <th>Species</th>
    <th>% of American households</th>
  </tr>
  <tr>
    <td>Dog</td>
    <td>38.4%</td>
  </tr>
  <tr>
    <td>Cat</td>
    <td>25.4%</td>
  </tr>
  <tr>
    <td>Bird</td>
    <td>2.8%</td>
  </tr>
  <tr>
    <td>Fish</td>
    <td>12%</td>
  </tr>
</table>
Conclusion
A complex image can be a great way to quickly express a lot of information. Depending on the complexity, you may need to explain it in different ways – maybe in a few paragraphs, a list, or a table. We want to make sure everyone can take advantage of the images you have created, so consider the best way to organize the information.